Bloodgang,
Welcome to the fifty-fourth issue of Bloodgood’s notes. The idea of this newsletter is to give you an overview of the previous week’s fundamentals and what happened on charts as well as to remind you of this week’s articles, secret TA tips, and trading calls. Basically, it’s about giving you all the key info in one place.
Table of contents
- Fundamental overview
- Bitcoin and Ethereum chart
- Blood’s content recap
- Concluding notes
As this community grows, I have a duty to give back to all of you that helped me and supported me to become what I am. This free newsletter is just another way to share my experiences and prepare you for the journey that’s ahead of you.
Love,
Blood
Fundamental overview
The insanity continues as more information has started to trickle out regarding the extent of the mess that FTX and Alameda were in. It seems like the theory I mentioned last time—that the collapse was a result of FTX lending to Alameda when the latter was on the brink of insolvency—will turn out to be true, but we’ll have more info tomorrow, when the hearing on first-day motions takes place in bankruptcy court.
Some of the people involved already believe that this will be the most complicated bankruptcy case in history, due to the extent of the screwup, the number of creditors, and the lack of regulatory clarity when dealing with crypto. The new CEO of FTX, who will be overseeing the bankruptcy proceedings, is John Ray III, who was also in charge of the liquidation of Enron two decades ago. He’s definitely got the relevant experience, but there will be quite some time before we know how much money will be returned to users. One potential upside is the fact that FTX had a venture arm—which still holds a ton of currently illiquid VC investments. If these positions become profitable (which could take years), this could go a long way towards providing the funds for customers to be made whole. Meanwhile, the FTX hacker started dumping ETH for BTC, reminding the market that there are many different ways that this kind of a massive event can cause volatility down the line.
Bitcoin, S&P 500 and DXY
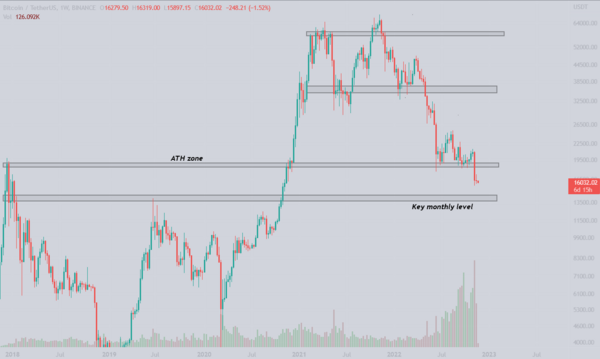
Bitcoin/Dollar Weekly chart

S&P 500
U.S. Dollar Index
Bitcoin closes another weekly candle way below the 2017 ATH zone, confirming the breakdown. The bulls’ last hope for this crash to be a fakeout is gone, now we eye the $14,000 zone and $11,000 next if the prior does not hold. Slowly bleeding to the downside will not triger an uptrend, we need to see a few big liquidations, a fakeout and then reversal. The Blood team is not looking to nail the bottom, we are trading level by level and currently our bids are at $14,000, in case they’re filled we will be looking for a bounce towards the previous ATH zone, where we derisk 50% and leave rest for the moon mission. Don’t get me wrong, i believe this is a good place to accumulate bitcoin for long term, however, taking some profits along the way to get more ammo in case we see lower levels is never wrong.
The S&P 500 is respecting our levels as it confirms support and provides a small bounce. If we see any strength in the markets this week we will be looking to test the trendline that has been forming since January 2022. Breaking the trendline would be the first sign of an uptrend in the bigger picture.
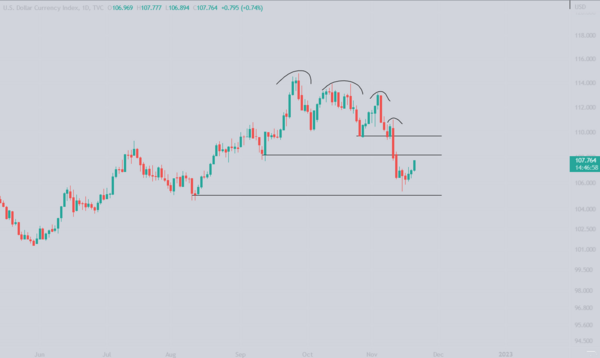
The U.S. Dollar index formed a new low once again, this time at 105.3. The levels to look for are as drawn on the chart, but all we are interested here is whether a new lower high is formed and the downtrend continues, which would give crypto and other risk-on assets room to move higher.
Ethereum
Ethereum/Dollar Weekly chart
Ethereum/Bitcoin Weekly chart
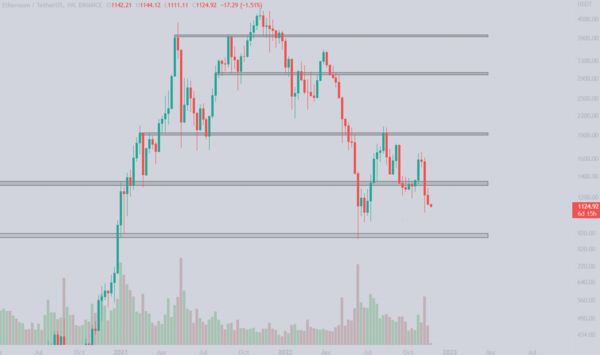
Markets fall as the FTX hacker starts selling ETH driving it towards the $1000 level which we have been eyeing since we lost the $1350-$1400 level. I am currently not interested in buying more Ethereum at this point and i will be waiting for the sub $1000 levels incase we see it. Seems like the trendline is holding as a series of lower highs were formed on a weekly timeframe. Any bounce into the trendline should be sold until broken.
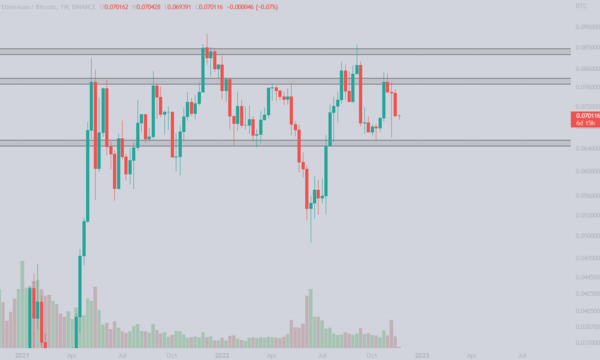
The ETH/BTC chart only confirms the ETH/USD story. We are in a “no-buy” zone, waiting for something to happen. The 0.065 BTC level is a buy and bouncing to the 0.077 BTC level should be a derisk zone.
Blood’s content recap
Swing Trading exercise #1: Trend Reversals with OBV
– Open an H4 or D1 chart on an altcoin
– Open On Balance Volume indicator
– If OBV is rising & asset price dropping, find LONG entries
– If OBV is dropping & asset price rising, find SHORT entries
Master this indicator ASAP.
New article
Master Trend Reversals in 5 minutes 💯
Traders lack the criteria for reversals and end up buying/selling too early.
In the article, I have mentioned the trend reversal indicators and patterns that are simple yet effective.
| Article on Trend reversals bloodgoodbtc.medium.com |
Concluding notes
We’re heading into quite the big week, with the FTX hearing mentioned above tomorrow, FOMC Minutes on Wednesday, and Thanksgiving after that, meaning that US markets will be open for less time than usual this week—and we all know that crypto tends to be more volatile and liquidity more scarce outside of US market hours. As if that’s not enough, Genesis, a huge lender in the space, has temporarily suspended withdrawals, setting off even more alarm bells about the possible domino effect of FTX/Alameda. In case you didn’t get the message: it might be wise to pay close attention to where and how you store your assets in a time like this.


