Bloodgang,
Welcome to the sixtieth issue of Bloodgood’s notes. The idea of this newsletter is to give you an overview of the previous week’s fundamentals and what happened on charts as well as to remind you of this week’s articles, secret TA tips, and trading calls. Basically, it’s about giving you all the key info in one place.
Table of contents
- Fundamental overview
- Bitcoin and Ethereum chart
- Blood’s content recap
- Concluding notes
As this community grows, I have a duty to give back to all of you that helped me and supported me to become what I am. This free newsletter is just another way to share my experiences and prepare you for the journey that’s ahead of you.
Love,
Blood
Fundamental overview
I’d like to wish you all a happy New Year once again in this first newsletter of 2023; may your year be as exciting as the markets were boring over the past few weeks!
The stock markets were closed yesterday, so we’ll see what today’s open will bring. In any case, keep in mind that we’ve got FOMC minutes tomorrow and non-farm payrolls on Friday, so there could finally be some volatility this week. The consensus for the NFP data is 200k with 3.7% unemployment, but NFPs have tended to exceed expectations over the past months, so I won’t be surprised to see that happen again. Of course, a positive surprise in jobs data is likely a negative surprise for those checking their stock or crypto portfolios afterwards, since it makes it easier for the Fed to continue to act tough on inflation.
In crypto, SBF is set to enter a plea this week; while a lot of people have been talking about this recently, I don’t think it’s likely to have much of an impact, because it’s typically in the later parts of the trial that the juicier info comes out. A more important thing to look out for is the whole DCG situation, as some of the recent Twitter conversations between Barry Silbert (CEO of DCG) and Cameron Winklevoss (co-founder of Gemini) don’t paint a too reassuring picture of what’s going on. As I mentioned before, we don’t have enough info at this point to do anything more than guesswork on what could happen with DCG and its subsidiaries, but if any notices of default are filed, that would have a devastating effect on the market.
Bitcoin
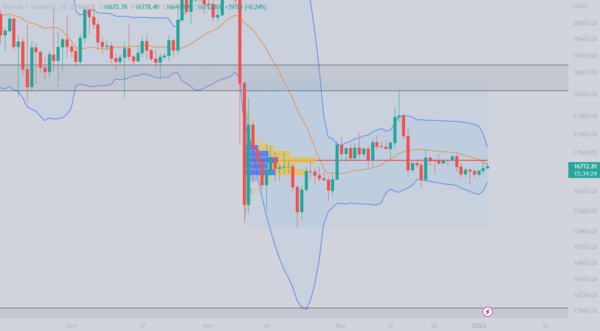
Bitcoin/Dollar Daily chart
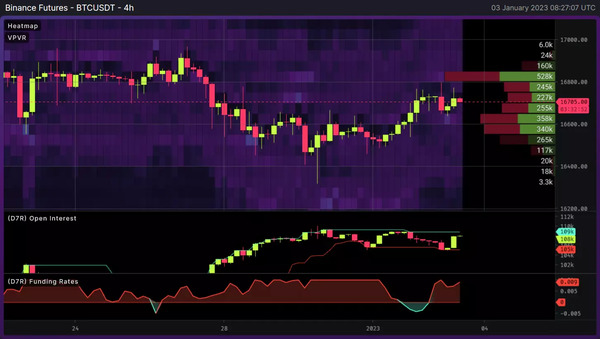
Bitcoin 4hr Heatmap

S&P 500 Daily chart

Gold Daily chart
Bitcoin seemed to be in the “holiday mood” over the New Year break, however it slowly broke down from the point control which is measured from the start of the range when bitcoin dropped below the $18,000 mark. Currently it is retesting the point of control and the reaction is something we have to monitor as US markets open. I also added Bollinger bands to the chart as an exercise was posted on Friday. Bitcoin still looks somewhat oversold, which is exactly what you want to see (if you are a bull) when testing the key area, but the bands are also starting to compress, meaning that we can expect increased volatility soon. Checking OI and funding rates on the 4hr timeframe and we can see that newly opened longs have driven this push up. Breaking above the PoC is the first sign of strength, getting rejected would mean that the lows are coming into play.
The S&P 500 is still trading below the key level, slowly making its way towards the ~ 3650 level. As long as it is trading in this range it does not interest us as it can go either way. No trade zone for me here.
Gold is making a move up, finally breaking above the level we were monitoring. Seems like gold has been the best performer of the assets we are paying attention to. Tough times are ahead and gold is proving its worth during the upcoming recession. Definitelly something to keep an eye on.
Ethereum
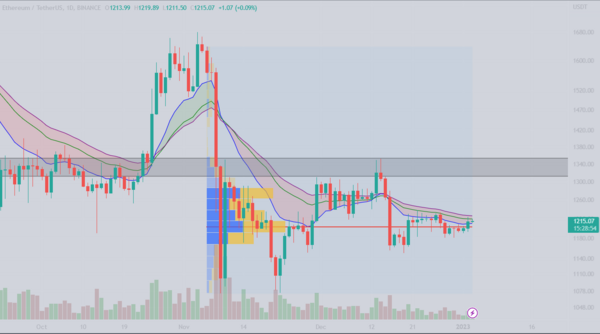
Ethereum/Dollar Daily chart
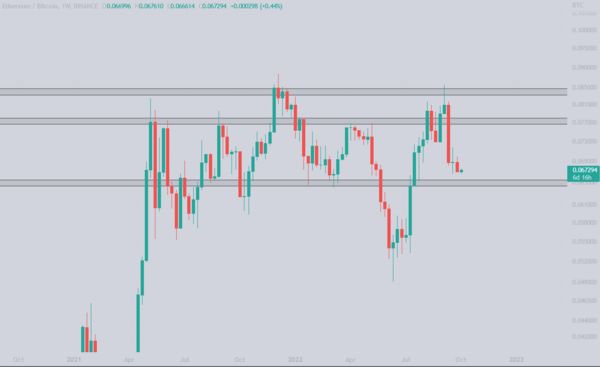
Ethereum/Bitcoin Weekly chart
Ethereum, unlike Bitcoin has already broken above it’s point of control, however it is facing short term trend (comprised of EMAs), which proved to be a strog resistance in the past. With the decreasing volume there are not many bullish signs that would support the breakout. But, keep in mind ETH is glued to Bitcoin’s movement at the moment, so anything can happen. With that said, Ethereum is not really tradeable at the moment and i would rather focus on Bitcoin and see if ETH can follow.
Going over the ETH/BTC chart we can confirm what we see on the ETH/USDT chart. Etheruem is glued to BTC, but still stuck in the downtrend formation and still in the middle of the range which is a no trade zone for us. Both levels that were mentioned in the previous letters are still in the play.
Blood’s content recap
Trading exercise – Master Bollinger Bands
“Bollinger will help you project breakouts and breakdowns.
– Upper band shows you the possibility of breakdown
– Lower band shows you the possibility of breakout
Use it with S/R to see whether price will break the level get rejected.”
Trading exercise – Master Bollinger Bands
— Bloodgood (@bloodgoodBTC) December 30, 2022
Bollinger will help you project breakouts and breakdowns.
– Upper band shows you the possibility of breakdown
– Lower band shows you the possibility of breakout
Use it with S/R to see whether price will break the level get rejected. pic.twitter.com/Ddz8Yd6CiA
Concluding notes
Market conditions are not too unexpected given the holidays and everything that’s been going on, with volatility compression and overall boredom in crypto. If trading this kind of a market environment isn’t your thing, then do yourself a favor and just observe or take some time off—remember that trading is just as much about knowing when not to enter a position. Getting chopped up by trying to anticipate breakouts is a fool’s game, especially with Bitcoin, which tends to be incredibly good at trapping liquidity.
The only thing that’s somewhat interesting now are the several narratives going around about different altcoins, and chances are, that’s your best bet to make money at a time like this. You’ve probably noticed how the narratives have been moving recently: anything having to do with AI, NFTs somehow having a moment again, and now more and more talk about Ethereum enabling withdrawals for staked ETH and all the new DeFi use cases that this will bring. Keeping an eye on these narratives is an insanely good investment—if you only catch them once they’re everywhere, you’re almost certainly too late. That being said, don’t marry any of your bags when BTC looks this indecisive.


